Make the news instead of waiting for it
I recommended original research timed to the season's money moments, from year-end planning to Giving Tuesday and tax season, so one dataset could feed PR, search, social and email through the quarter.
How I turned a consumer survey into the news moment a just-launched AI fintech needed, with each chart and claim cleared by SEC compliance first.
The launch had used up the obvious story. To keep journalists calling a young brand, we needed news only we could make, and a way to prove our positioning: purpose-built for financial decisions, not another general chatbot.
I was leading the PR team. The agency could pitch, but it needed something worth pitching.
Under the SEC Marketing Rule, each chart, statistic and headline is an advertisement. Nothing ships until compliance signs off.
| Result | What it means |
|---|---|
| 1 day | From release to a Barron's feature built on the study |
| 7 outlets | Covered the study in its first week, about one new outlet a day |
| 4 briefs | Themed data briefs mapped to news moments over the following months, each with pitches drafted |
| 55 targets | A second lane built for backlinks and infographic reuse, with a draft for each target |
| 5M+ | Estimated additional article views across 61 placements |
I recommended original research timed to the season's money moments, from year-end planning to Giving Tuesday and tax season, so one dataset could feed PR, search, social and email through the quarter.
3,097 people took the survey. Only the 1,981 who passed quality screening were analyzed, and each published figure carries its base.
Each statistic was sourced, each draft watermarked, and each asset went in with a fact-check document, so approvals moved as fast as the work.
I coded the study pages to stay out of search until release morning, then switched on indexing and added the wire link as the release crossed.
Reporters had the data under embargo ahead of the press release, so their stories were ready when it crossed. It was the first release on Evergreen's own Business Wire account, at 8:05 AM ET, with the CEO's newsletter and the study video timed to follow within 90 minutes.
The AI and money cascade
Source: The Evergreen.ai Financial Decisions Study (3,097 U.S. adults surveyed; 1,981 analyzed). Rebuilt here from the published chart.
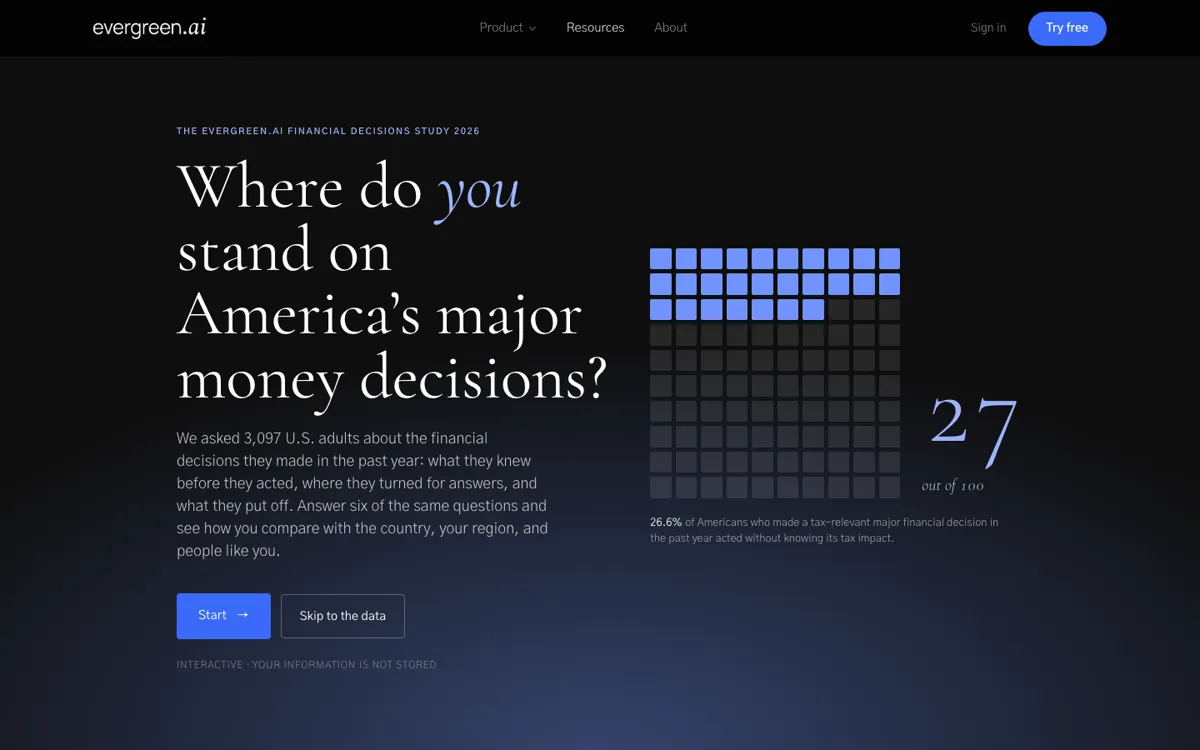
Six animated infographics, each cut for social and the press kit. A 49-chart pack anyone could reuse with one source line. Five regional briefs that gave local and trade reporters their own angle.
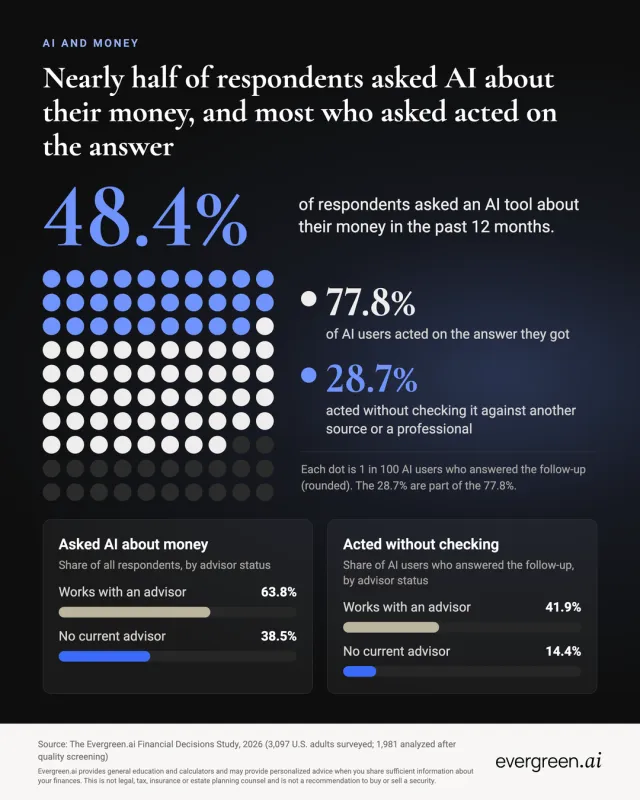
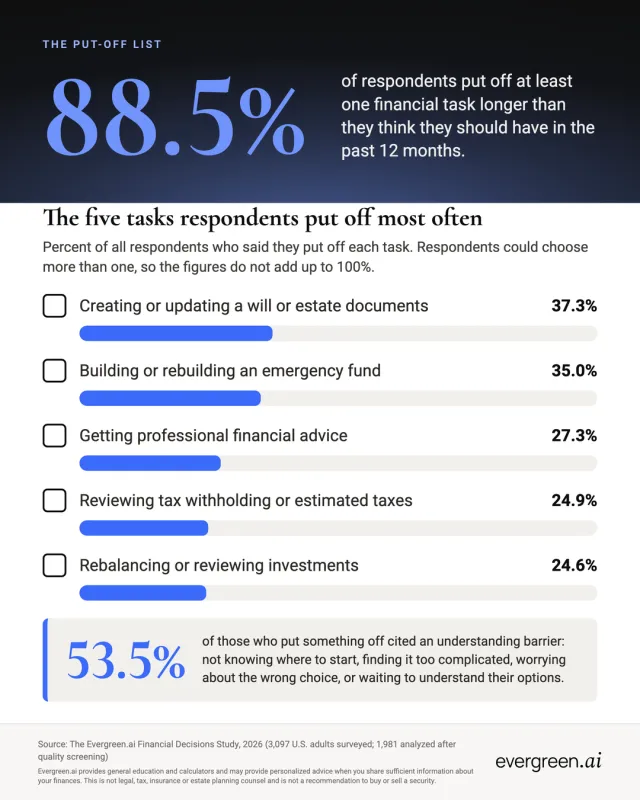
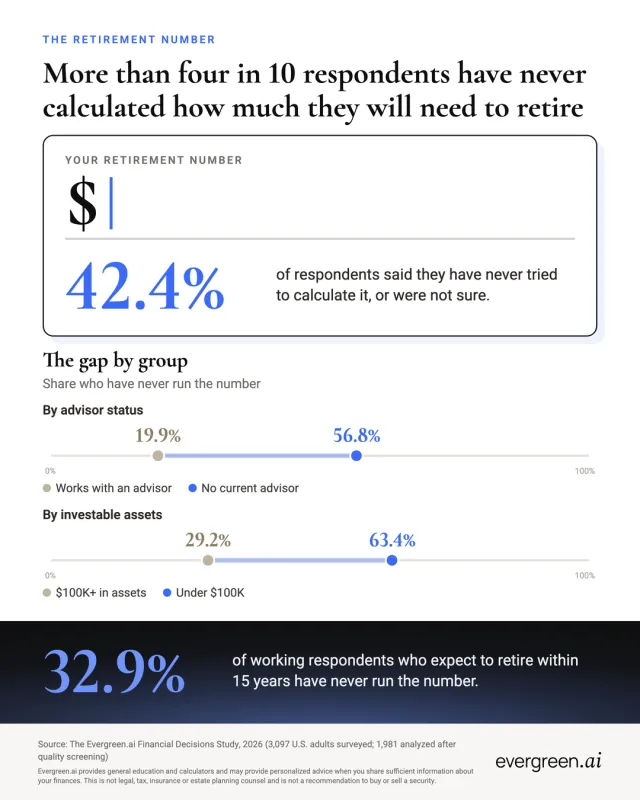
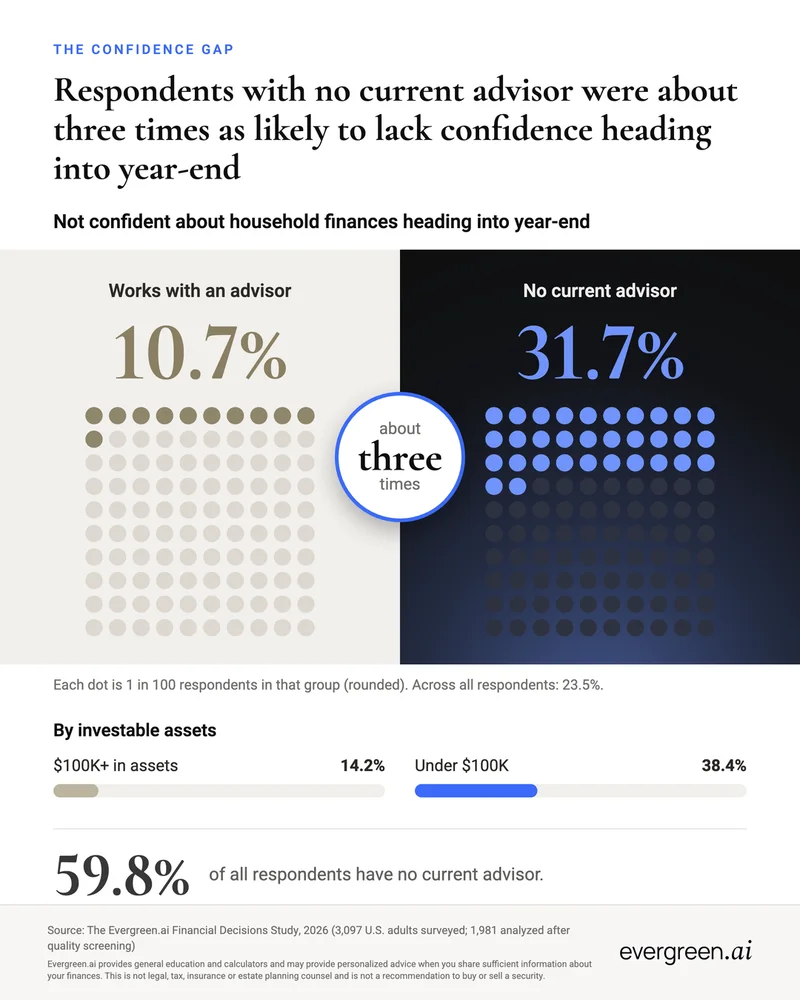
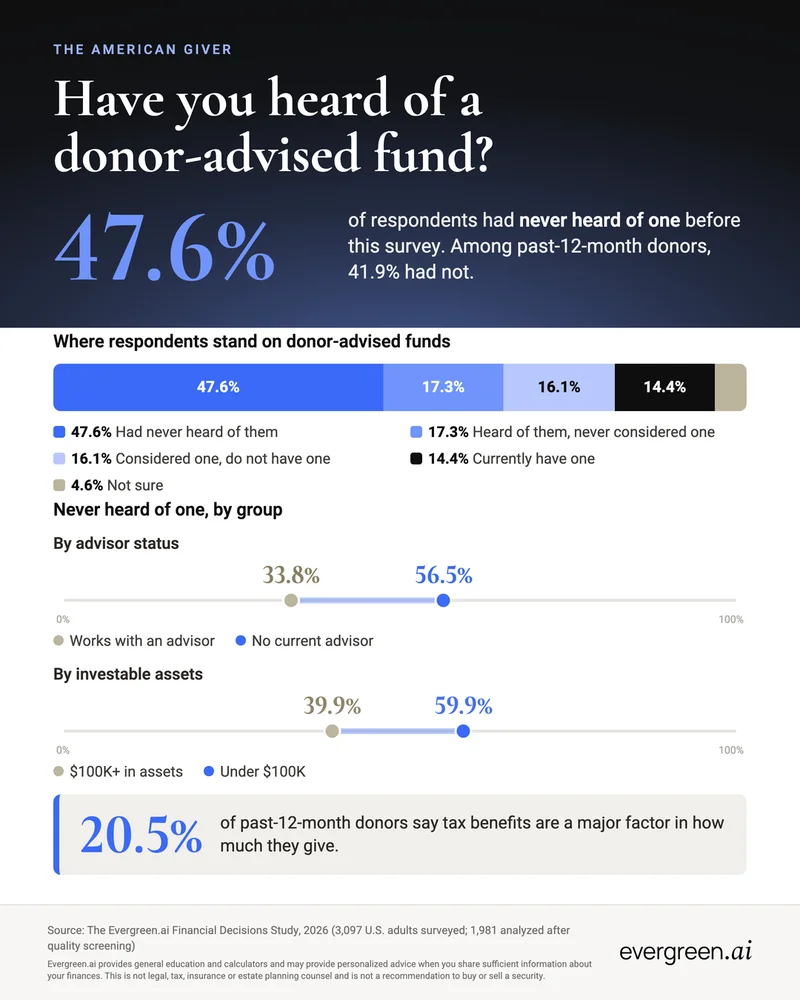
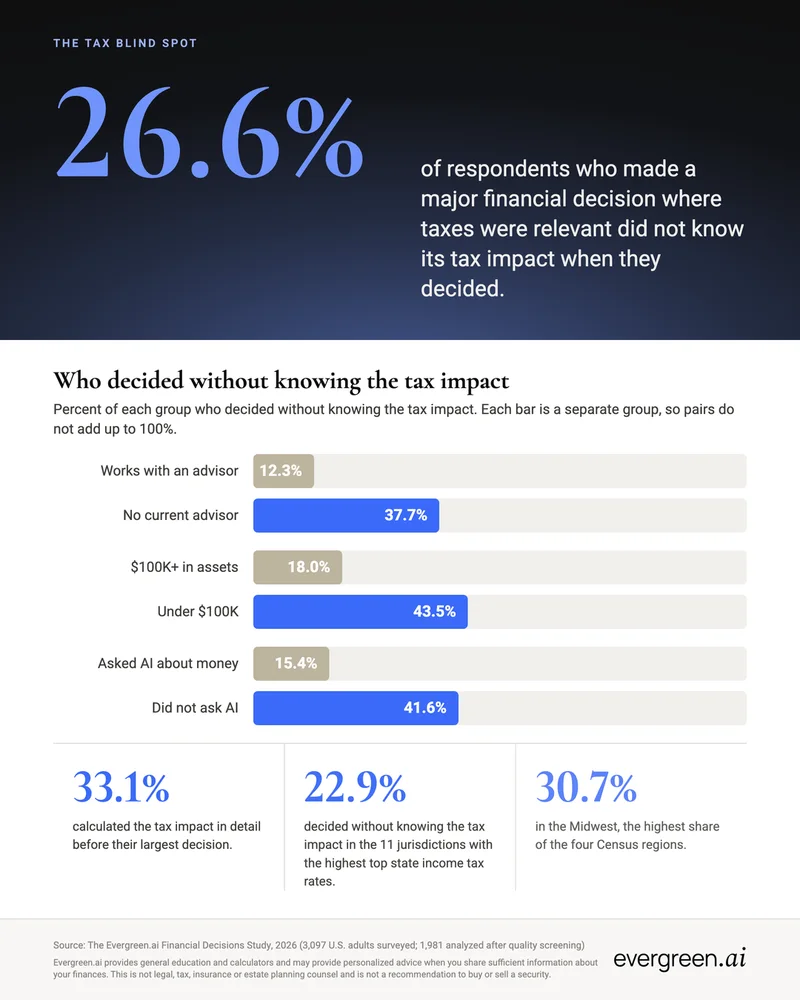
18 charts from the report, in report order, plus 31 comparisons readers can build on the interactive page: each measure by region, by assets and by whether people have an advisor.
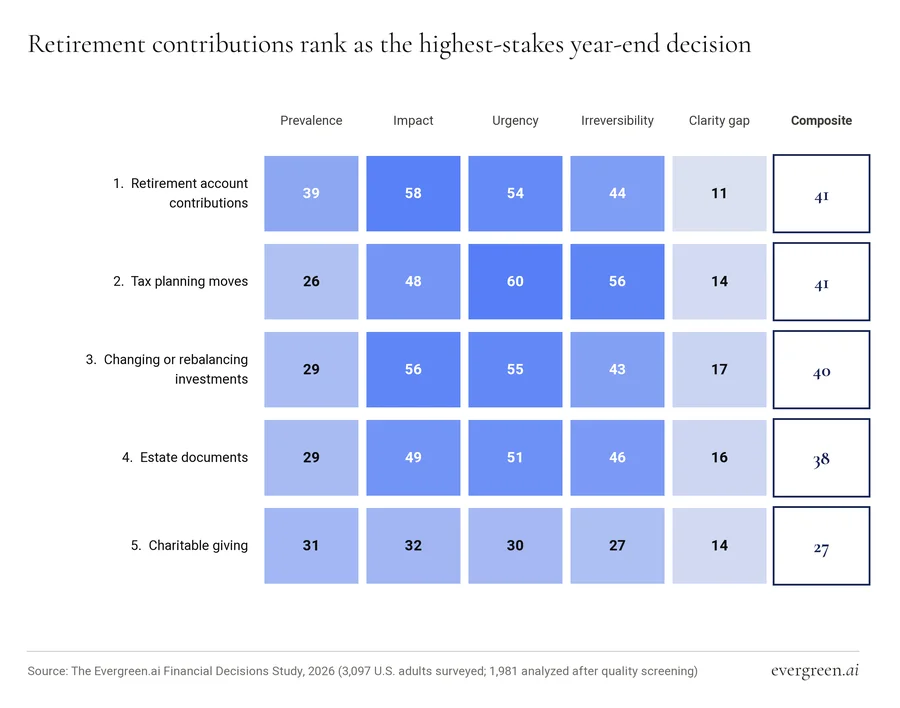
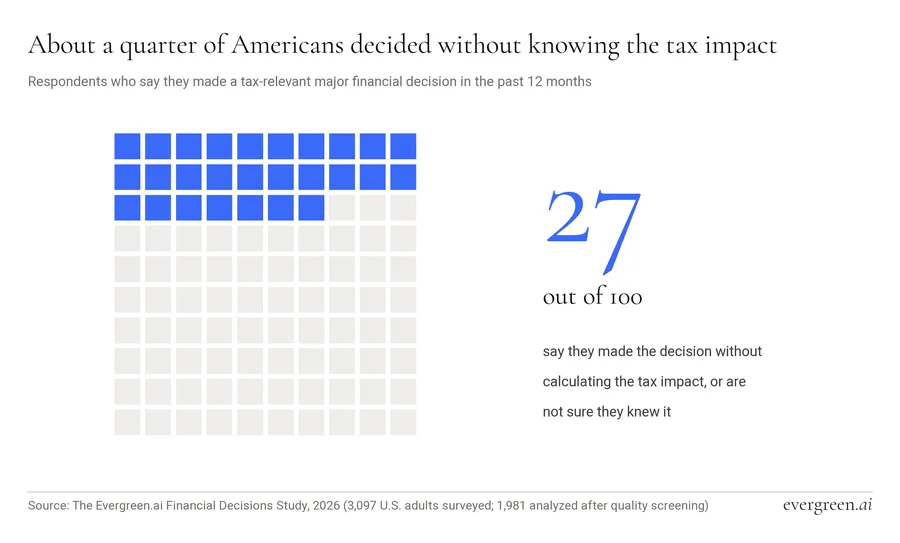
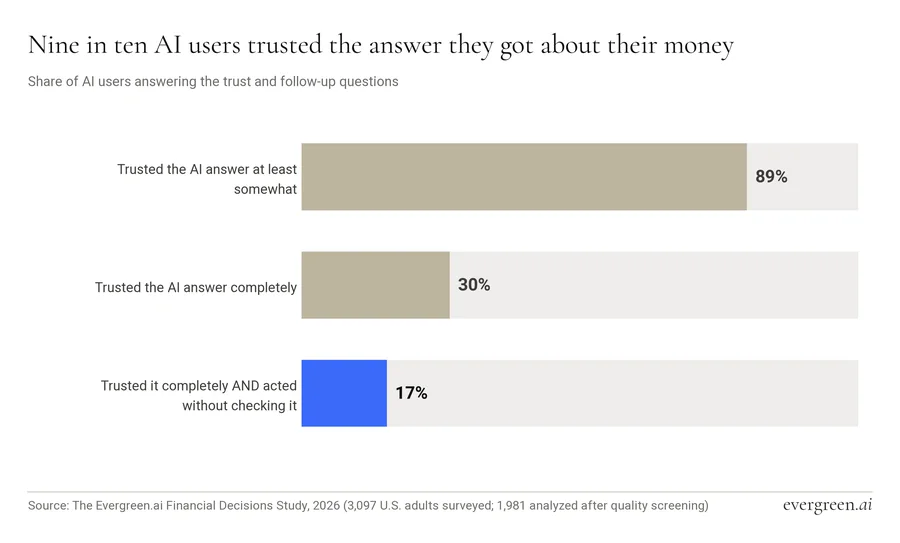
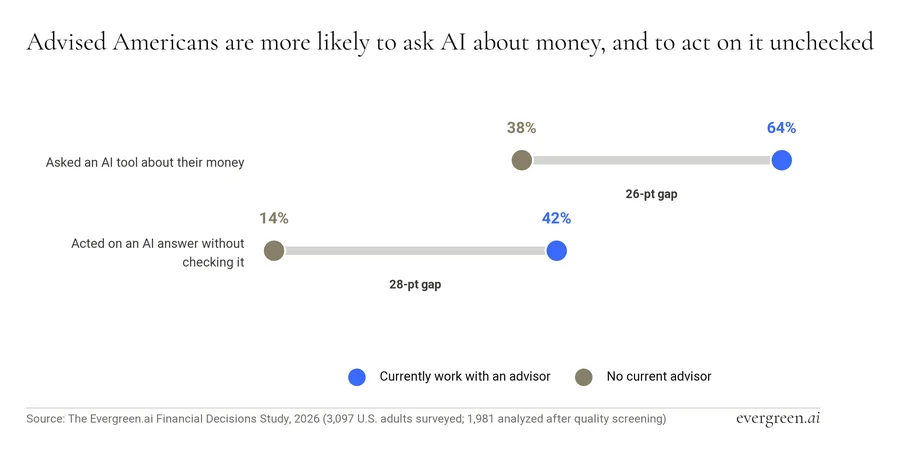
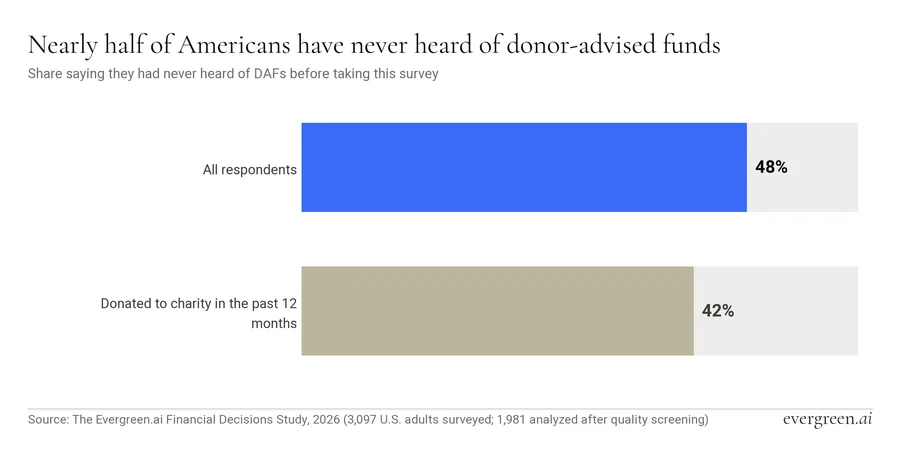
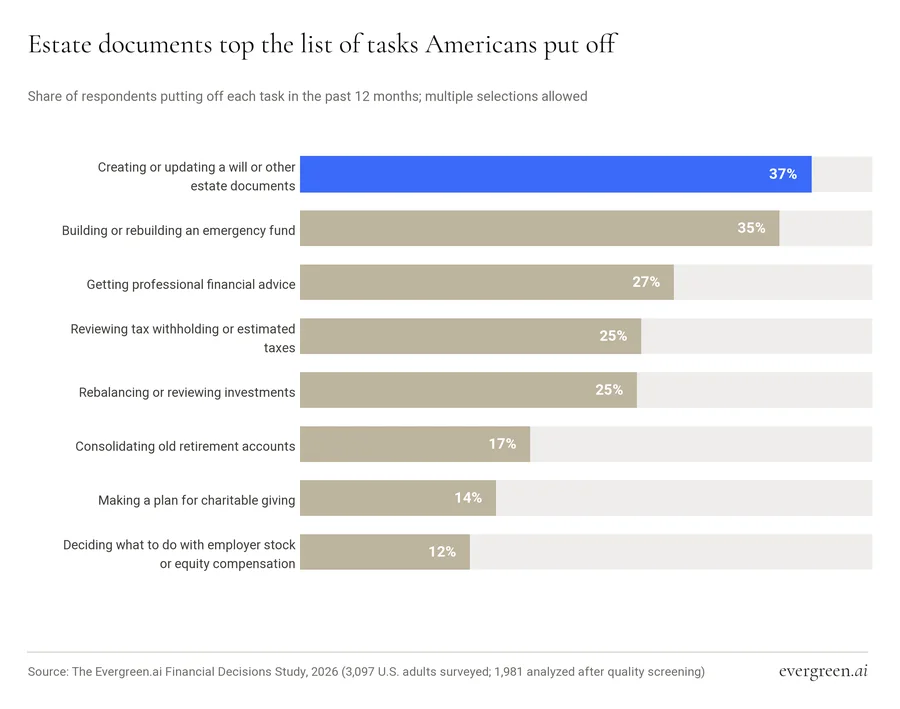
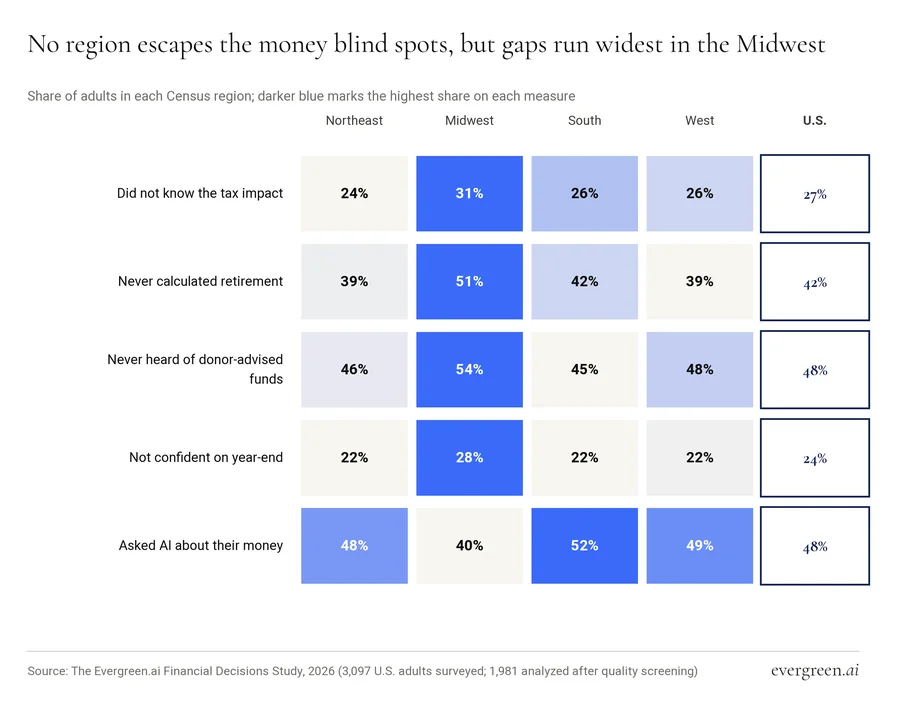
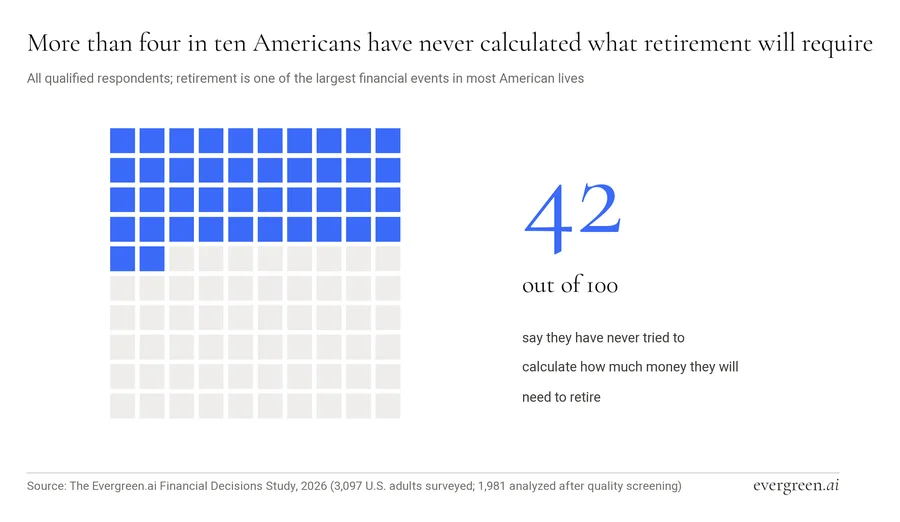
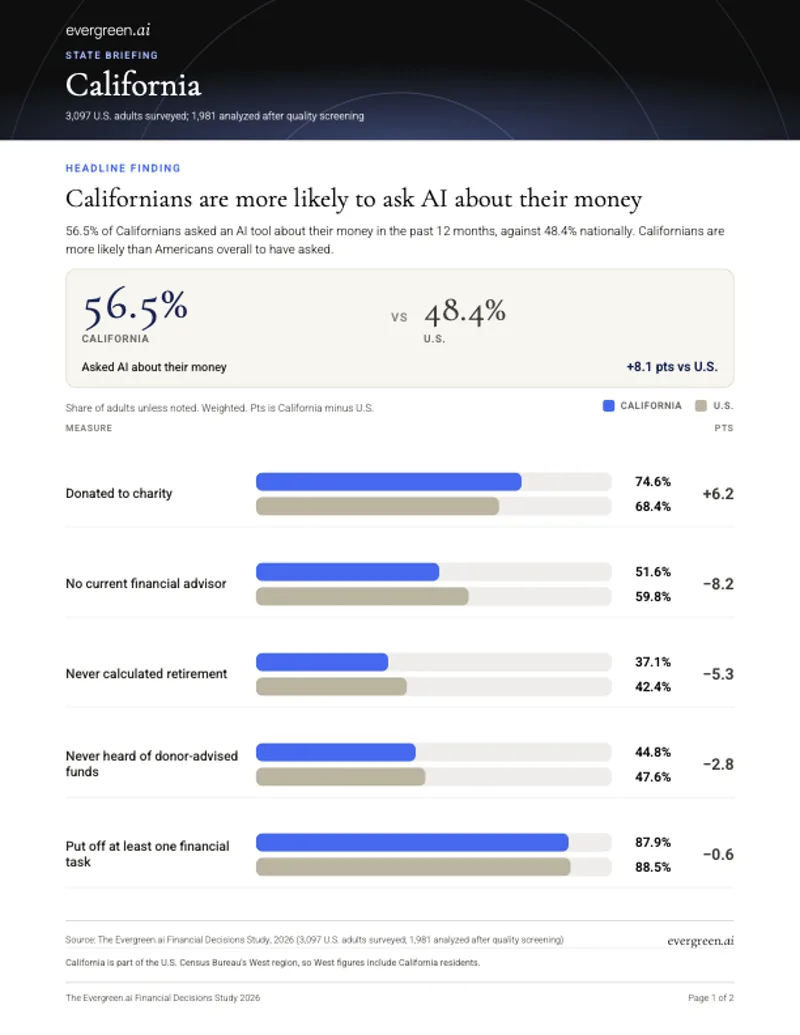
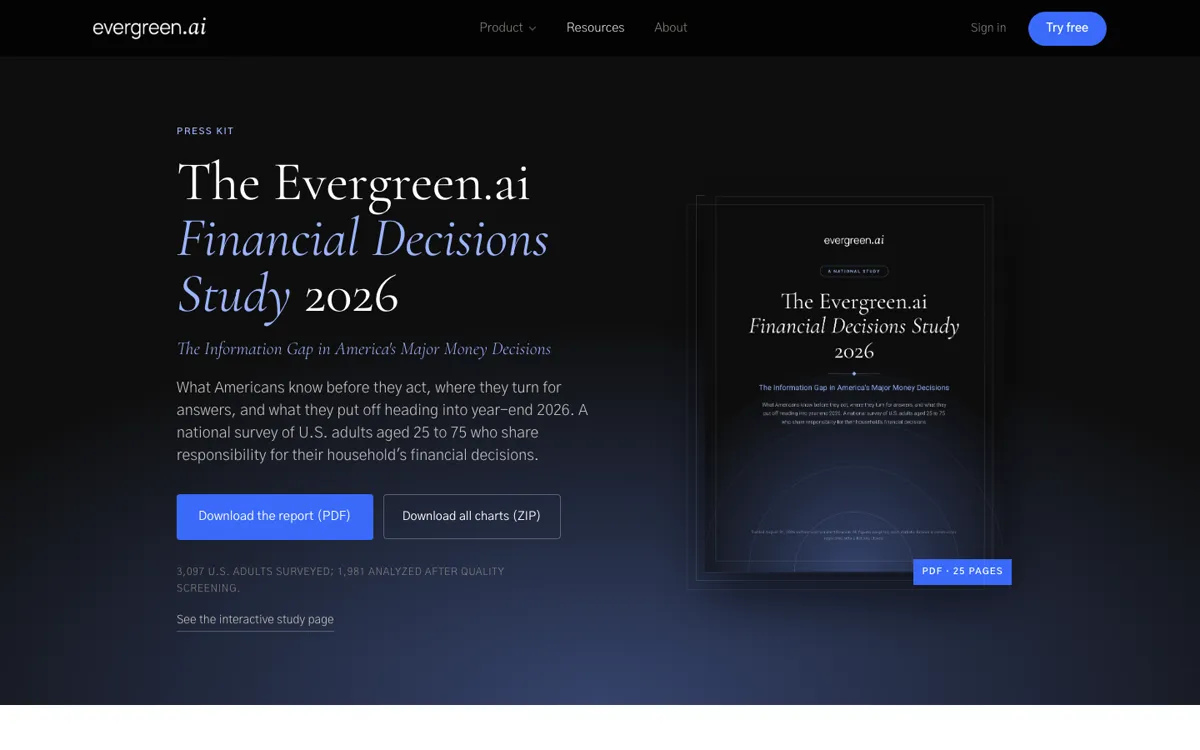
Using an AI pipeline, I produced a comprehensive set of assets in a compressed timeframe that would not have been possible without it.
And the case for original research over another product announcement.
U.S. adults through SurveyMonkey Audience, an affluent-frame classification and a state-level contingency.
From raw responses to each published figure, traced to its base.
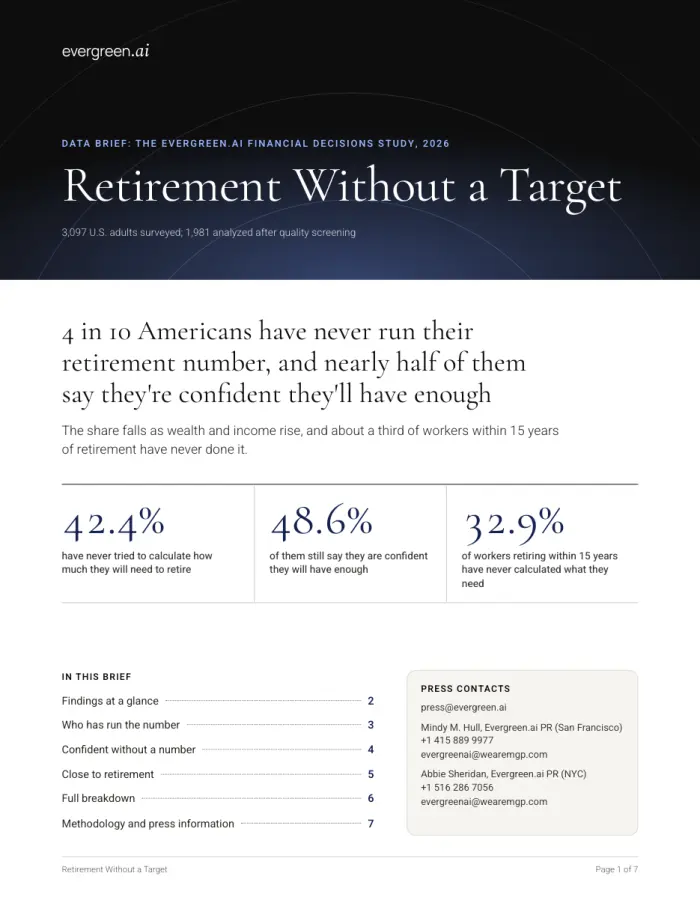
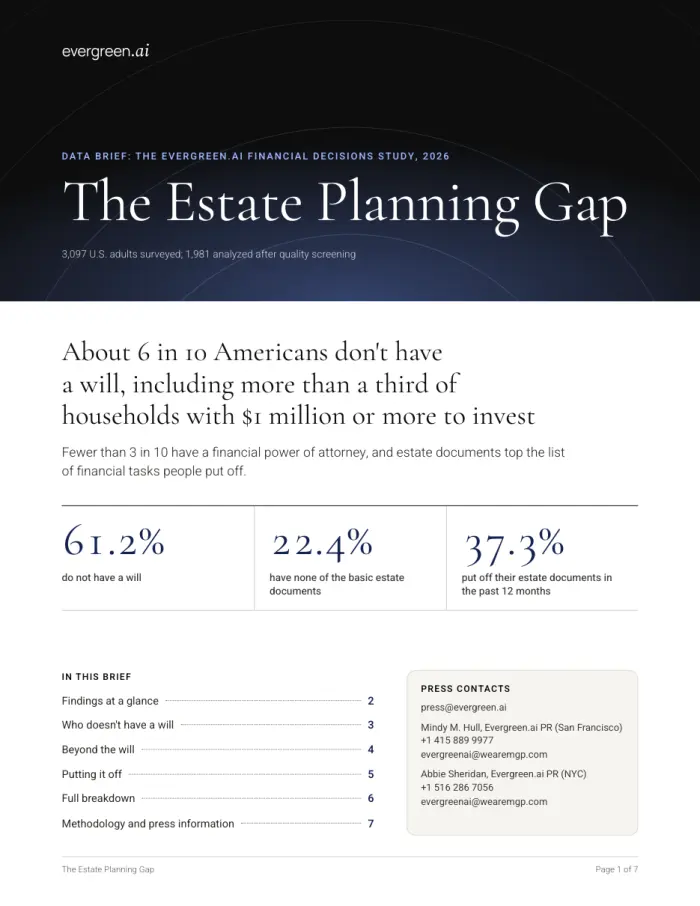
The 25-page report, five regional briefs and four themed data briefs.
The press release draft, compliance clearance of each asset and the embargo plan.
Plus the findings article. I coded the three myself.
The CEO's newsletter issue, social and the resources feature.
"Clients Are Cheating on Their Financial Advisors. With AI."
Same-day pickup in the advisor trade press.
"Clients with advisors more likely to act on unchecked AI answers"
Six days after release, the study had a CNBC interview with the CEO booked, the TODAY show weighing a segment and eight more outlets working with the data. The company's decision to move in a different strategic direction paused the opportunities the study generated.
Source: the PR agency's embargoed-pitching and pending-opportunities recap.
The report carried most of the survey, but I kept several deeper breakouts in reserve. I mapped each one to a moment reporters would already be covering through year-end, and built a two-page data brief and pitches for each, so each new moment brought reporters numbers they had not seen yet.
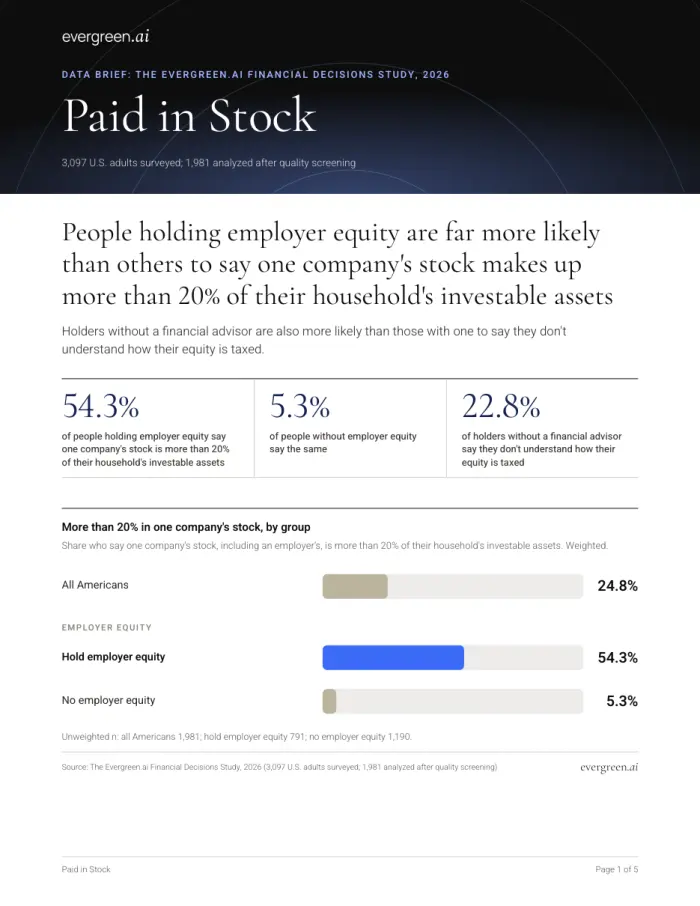
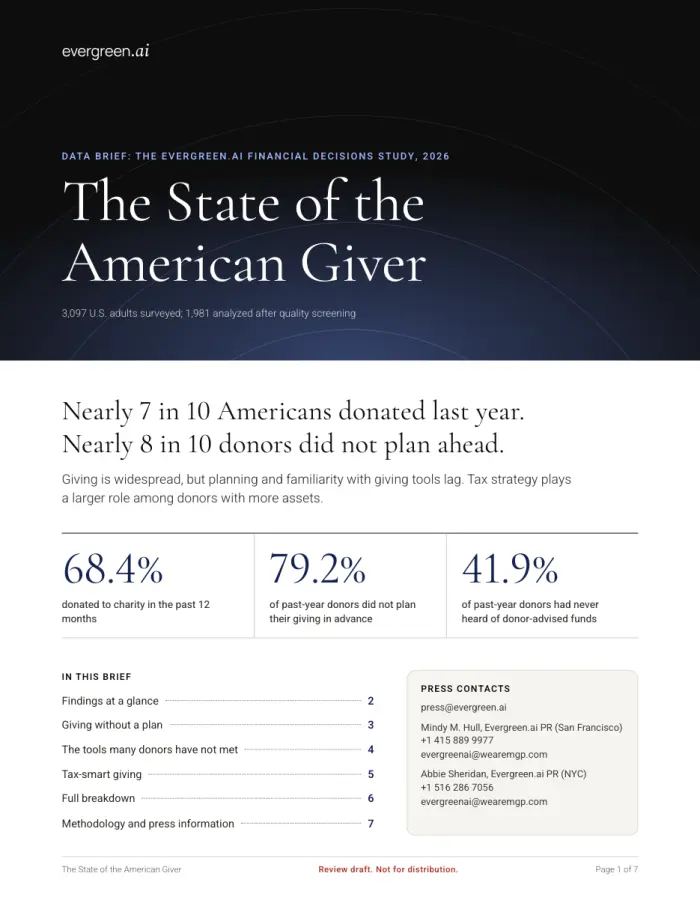
The day after release, I built a second distribution lane for the study: creators, newsletters, podcasts, bloggers and resource pages that cite data and need visuals. The goal was backlinks to the study page and reuse of the infographics we had already made.
55 targets, by channel
Each target has a named person, a contact route, their most relevant recent piece, one angle and one matching infographic. Sequenced in four waves.
Using DataForSEO, I pulled the links to four competing AI and money studies from NerdWallet, LendingTree and TD: 577 linking pages. NerdWallet's headline count was mostly one feed. About 360 of its 385 referring domains were CPA-firm sites republishing a single article.
Six infographics, each as a PNG, GIF, MP4 and 1200 by 630 social card, plus the 49-chart pack. Anyone could reproduce them with one approved source line.
Search the study name and each headline statistic, and reverse-image search the infographics. Coverage that linked only to the wire release, or to nothing, would get a note asking it to point to the study page.
Edition 01 was built on a survey I designed. A single study earns a news cycle; a recurring one gives reporters a beat to come back to. From the next edition on, each release would pair the ongoing survey with first-party data from the product.
The first edition was built on survey data, from questions I wrote. Asking the same core questions in each edition turns a one-time release into a trend line. Each new edition gives each outlet that cited the last one a reason to cover the next, and each infographic a newer version to replace.
Time each edition to a money moment: tax season, midyear, open enrollment and year-end giving. The press list and the creator lane get re-pitched with fresh numbers, so distribution compounds instead of starting over.
From the second edition on, the survey would continue, joined by aggregated, anonymized data from Evergreen.ai itself: the money challenges people bring and the questions they ask. A survey shows what people say. Product data shows what they actually ask. A competitor can copy a survey, but not that.
Own a recurring dataset and you own the conversation. The survey earns attention, the cadence keeps it, and the product data makes it impossible to copy. Each edition goes through the same compliance review, so the program scales without adding risk.